Information Design - Exercises
Week 1- Week 4 (06/01/20 - 21/02-20)
Nyoman Anita Putri Arimbawa (0339942)
Information Design
Exercises
by Wurman in his book ‘Information Anxiety’ It was called the ‘Five hat racks’ concept.
in class and create one information poster about it. Must use one color.
Requirements
Use a digital photo editing / illustration software available to assemble the Pokemon into a LATCH infographic poster. You can re-use back the images of the monsters, but do create the rest of your own visuals to complete the poster.
Fig 2.19: Final Result (PDF)
Nyoman Anita Putri Arimbawa (0339942)
Information Design
Exercises
LECTURE
WEEK 1:
The class begins with introduction on the lecturers and also a brief on the module, and also explaining briefly on what are the exercises and also the project.
Mr. Kannan begins the lecture on our first flip topic which is Manuel Lima’s 9 Directives Manifesto, the 9 directives are Form Follows Function, Interactivity is Key, Cite Your Source, The Power of Narrative, Do Not Glorify Aesthetics, Look for Relevancy, Embrace Time.
After the lecture Mr. Kannan instructed us to form a group with 3-4 people with in the group, he explain that there are will be a few activities that will be done in the group such as the flip presentation and also our final project. For our next class we must be in a group and do a research and presentation on the flip topic that is given to us.
Research:
We need to find our definition of our own about Manuel Lima’s 9 Directives Manifesto and add a a bad example also the good provided with an explanation o why we choose that
After we done our research we make our slide.
WEEK 2:
Our second topic is about Saul Wurman’s L.A.T.C.H.
Research:
Saul Wurman’s L.A.T.C.H is a is a method used to organize information. the L.A.T.C.H stands for
location, alphabet, time, category and hierarchy, it was discover
The class begins with introduction on the lecturers and also a brief on the module, and also explaining briefly on what are the exercises and also the project.
After the lecture Mr. Kannan instructed us to form a group with 3-4 people with in the group, he explain that there are will be a few activities that will be done in the group such as the flip presentation and also our final project. For our next class we must be in a group and do a research and presentation on the flip topic that is given to us.
Research:
We need to find our definition of our own about Manuel Lima’s 9 Directives Manifesto and add a a bad example also the good provided with an explanation o why we choose that
After we done our research we make our slide.
WEEK 2:
by Wurman in his book ‘Information Anxiety’ It was called the ‘Five hat racks’ concept.
Location:
Organizing information by its location.
Example - Atlas and Travel Guide
 |
| Fig 2.1: example |
Alphabet:
Organizing information based on alphabetical order aka A-Z, best use when working with a big data such as - dictionary and contact

Fig 2.2: example
Time:
Time is a good organizing principle for information which happen over fixed duration.
ex: weather, schedule and history
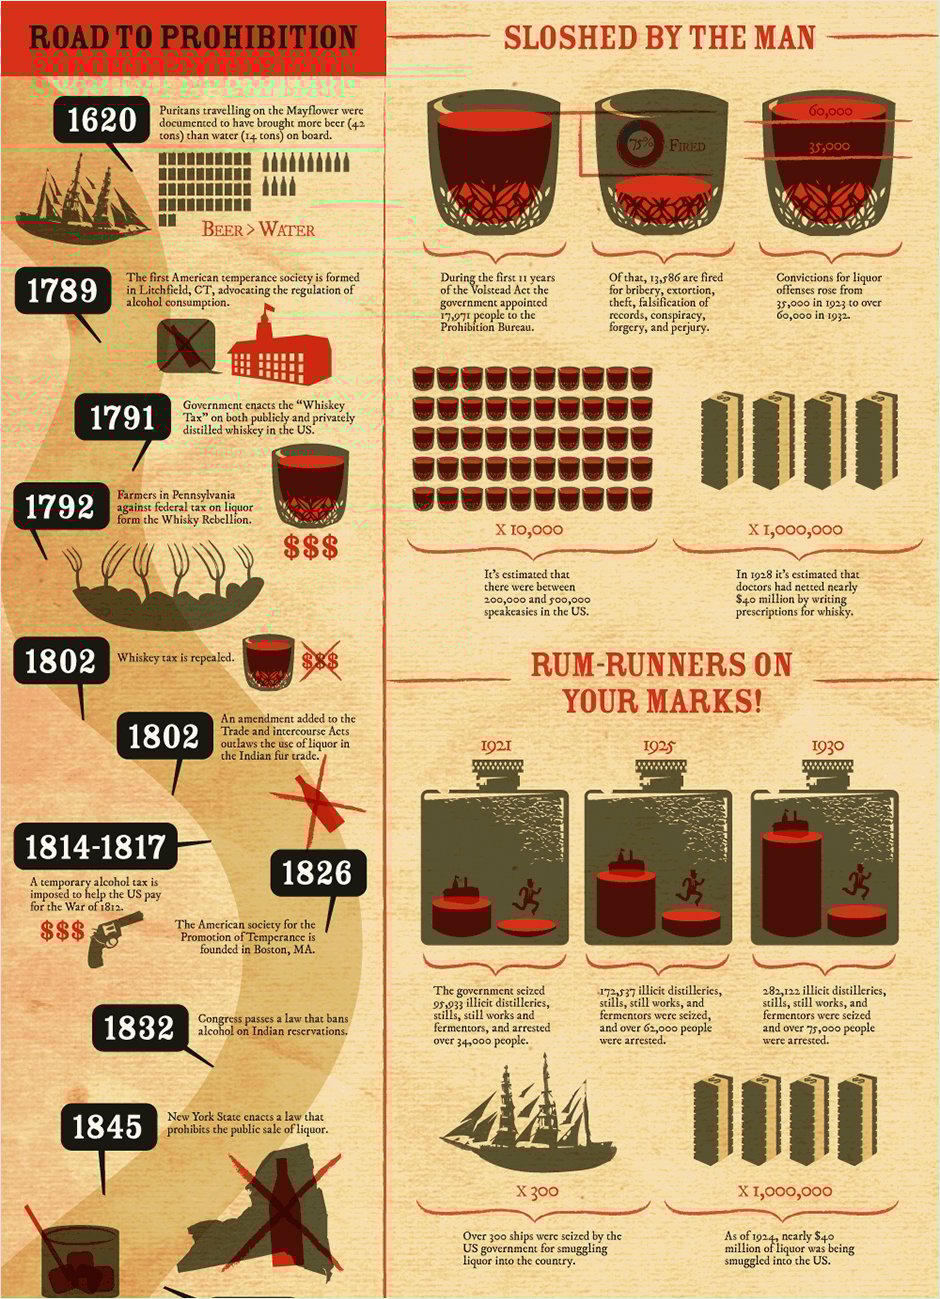
Fig 2.3: example
Categories

Fig 2.4: example
a method of organizing information based on similar importance or characteristics
Hierarchy:
Hierarchy is a system of organizing using a design element in order of importance such as size, price,quality. Usually a hierarchy is created by a contrast between visual elements in a composition.
Hierarchy is a crucial part for making any good design, it influence the order on what things we see,
Usually a hierarchy is created by a contrast between visual elements in a composition. Typically we see an elements with the highest contrast, other than contrast there are many method to make hierarchy such as scale, color n contrast,space The benefit are to Create direction .Add emphasis Add structure, Create visual organisation.
It also help a viewer navigate and digest information easily ,know what information is more important than other information.

Fig 2.4: example
My team's slide
|
| Fig 2.2: example |
Time is a good organizing principle for information which happen over fixed duration.
ex: weather, schedule and history
|
| Fig 2.3: example |
Categories
|
| Fig 2.4: example |
Hierarchy:
Hierarchy is a system of organizing using a design element in order of importance such as size, price,quality. Usually a hierarchy is created by a contrast between visual elements in a composition.
Hierarchy is a crucial part for making any good design, it influence the order on what things we see,
Usually a hierarchy is created by a contrast between visual elements in a composition. Typically we see an elements with the highest contrast, other than contrast there are many method to make hierarchy such as scale, color n contrast,space The benefit are to Create direction .Add emphasis Add structure, Create visual organisation.
It also help a viewer navigate and digest information easily ,know what information is more important than other information.
|
| Fig 2.4: example |
My team's slide
Week 3
Our next topic for our flip presentation is that chunking.
Week 6
Lecture 4 & 5 - Different types of Infographics and Online tools
Flip 4:
Find different types of infographic + an example for each diffrent type.
Flip 5A: As individual, each one of you pick one free online infographic tools and re-design one example from Flip 4 through experimentation with the online tool.
Flip 5B: In your group, compile everyone’s redesigned infographics with before and after comparison and their personal rating + review of the online tool for
Ours team presentation
INSTRUCTION
Exercise 1
Week 1
For our first exercise on week one is about Quantify & visualize data. the instruction is
Quantify (count) the given items (BUTTONS / LEGO BRICKS)in class and create one information poster about it. Must use one color.
Requirements:
Information must be presented as is. You are required to arrange the objects on a piece of paper (max A4) with relevant indicators written out with pens to help you visualize the quantity and data. Take a picture of the final assembly and submit to Google Classroom as instructed.
Information must be presented as is. You are required to arrange the objects on a piece of paper (max A4) with relevant indicators written out with pens to help you visualize the quantity and data. Take a picture of the final assembly and submit to Google Classroom as instructed.
The student in our class begins to pick a buttons or a Lego, I picked a green/jade buttons.
Process:
 |
| Fig 1.1: Buttons |
The first thing I notice on my buttons is that there are two types of number of holes in my button, one holes and two holes, then i group them by size.
 |
| Fig 1.2: Buttons |
After that I begin grouping the by the surfaces(flat or embed), texture (marble or glossy) and color (lighter or deeper).
Final outcome
 |
| Fig 1.3: Buttons (fin) |
Exercise 2
Week 2
With our information that we have learned through Ms. Anis lecture and also through our research on the Saul Wurman’s L.A.T.C.H.we need to interpret our knowledge on that matter on our next exercise, we need to assemble four different Pokemon that are based on the same generation.
Use a digital photo editing / illustration software available to assemble the Pokemon into a LATCH infographic poster. You can re-use back the images of the monsters, but do create the rest of your own visuals to complete the poster.
First i did some research on the pokemon, on wikipedia and so on
I gather a few about Pokemon I decided to pick the first generation because that is the generation that I'm the most familiar with then I gather a few infomation about that,
Research
The first generation (Generation I) of the Pokemon franchise features the original 151 fictional species of creatures introduced to the core video game series in the 1996 Game Boy games Pokémon Red and Blue.
then I also found a very helpful on the data of the pokemon
Link
I also need to find a few refrences photo
After I have all the information that I needed, then I use the LATCH technique to organize the information
Process
after I gather a few ideas I begin to sketches my ideas
Then I begin to digitalize my ideas, First i need to gather all the element that I will need for this exercises such as the pokemon, the font and also the symbol, I use the picture I took on the internet and put them in Photoshop so i can cut it.
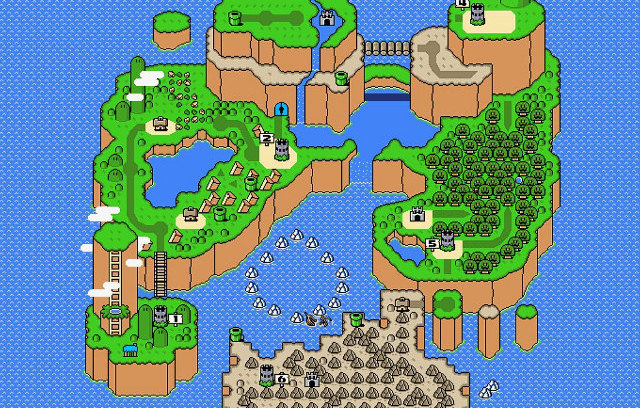
I wanted to make the location looks like a game almost like a game map so for my graphic style i choose pixels
Moving to Illustrator, in there i will be making all the other element for the poster.
Sice I wanted my graphic style to have the a pixel effect I make a grid and use the live paint tool to paint each grid. First i make all the location of the Pokemon like an ice mountain
I gather a few about Pokemon I decided to pick the first generation because that is the generation that I'm the most familiar with then I gather a few infomation about that,
Research
The first generation (Generation I) of the Pokemon franchise features the original 151 fictional species of creatures introduced to the core video game series in the 1996 Game Boy games Pokémon Red and Blue.
then I also found a very helpful on the data of the pokemon
 |
| Fig 2.6: Resource |
I also need to find a few refrences photo
 |
| Fig 2.6: Research |
 |
| Fig 2.7: Research |
After I have all the information that I needed, then I use the LATCH technique to organize the information
 |
| Fig 2.8: LATCHing |
Process
after I gather a few ideas I begin to sketches my ideas
 |
| Fig 2.9: Sketch |
 |
| Fig 2.10: Sketch |
 |
| Fig 2.11: Process |
I wanted to make the location looks like a game almost like a game map so for my graphic style i choose pixels
Moving to Illustrator, in there i will be making all the other element for the poster.
Sice I wanted my graphic style to have the a pixel effect I make a grid and use the live paint tool to paint each grid. First i make all the location of the Pokemon like an ice mountain
 |
| Fig 2.12: Process |
 |
| Fig 2.13: Process |
then I make an volcano
 | |
|
 | |
|
also some bushes, rocks and trees
 | |
|
carry on to that i begin to make the rest of the background
 | |
|
I also make the colloum and the arrows
Finally I compose all the elements
 | |
|
Fig 2.19: Final Result (PDF)


Comments
Post a Comment